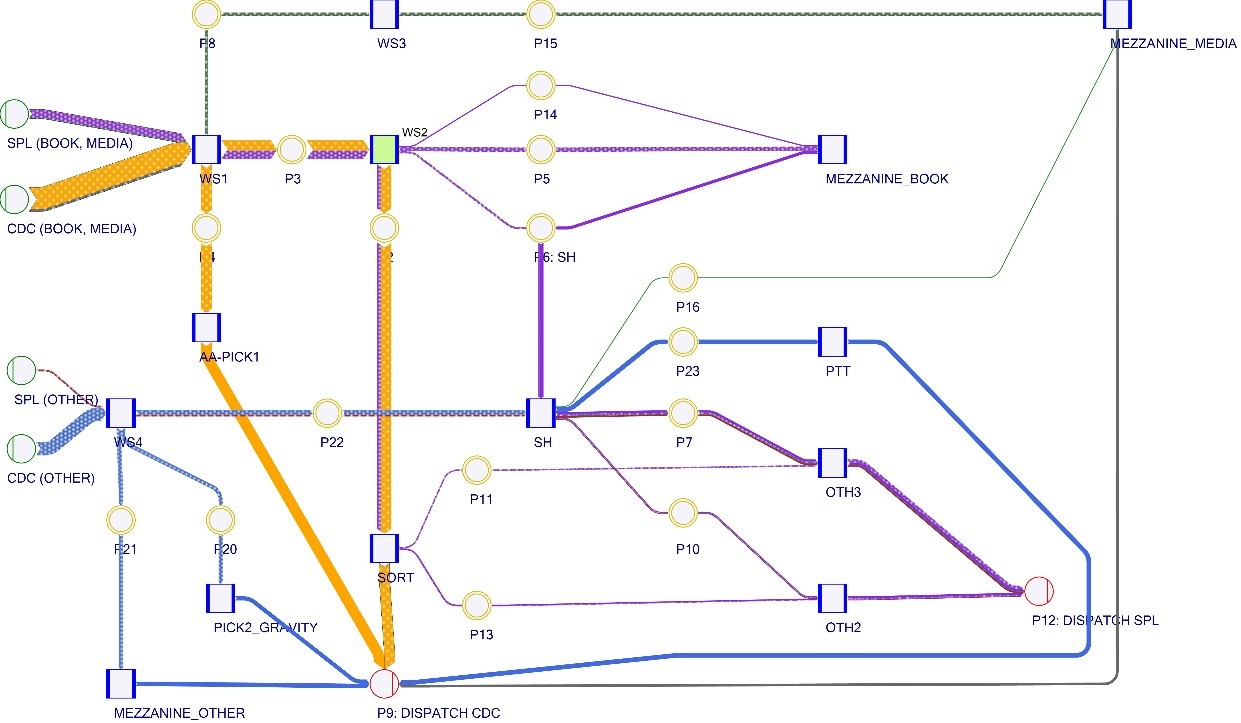
By definition, stream analysis is a computational method that allows you to trace how goods flow through the warehouse. From the input, through all processes, to preparation for dispatch. This is most graphically represented by Sankey diagrams, which show the flow paths along with the processes included in these paths.
A Sankey chart is a graphical expression of a flow path, where the width of the flow path is dependent on the size of the flow in question. The wider the stream, the greater the flow. With this depiction, hot spots can be defined more quickly and critical points for the flow path can be determined.

Process mapping and optimisation
In process mapping, it is essential to define the following elements:
- The beginning and end of the process in terms of their flow
- The structure of the process, i.e. what components influence the process
- The points of entry into and exit from the process or its intermediate elements
- The people (so-called actors or process owners) who are involved in the process (these include warehouse staff, production staff, suppliers, etc.)
- The owner or person who manages and supervises the process
- Performance evaluation criteria (the optimal number is 4 performance indicators).
- Influence on the overall process chain expressed in process key indicators
- Performance measurement tools
- Criteria and tools to control the process
- Resources required for the process, which at the same time have an impact on costs (e.g. human resources, material resources, IT)
- Process deviation scenarios
- Necessary documentation of the process flow.
Would you like to find out more? Feel free to contact us!