Goods flow analysis in logistics
A computational method indicating the course, dependencies and results of the streams of incoming and outgoing units in a warehouse passing on their way through successive processes of preparation for dispatch. The results are usually expressed graphically by means of Sankey diagrams.
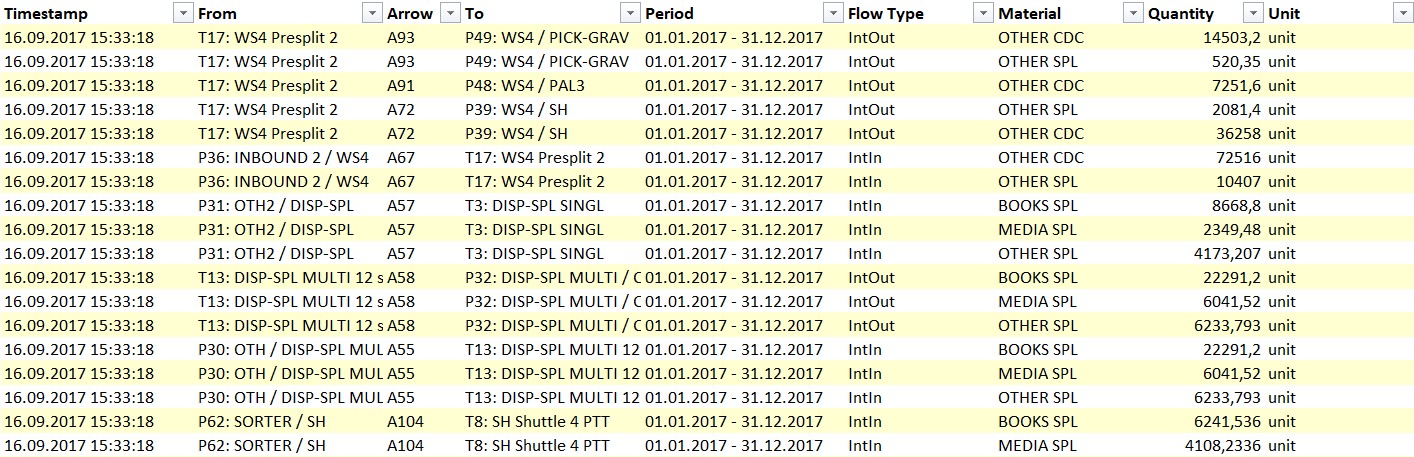
Keep readingStream analysis is used in logistics planning for individual commodity groups to determine the throughput of subsequent process nodes in the path of a given stream (e.g. preparation for picking, packing, etc.), which depends on the performance of the process node (e.g. human labour, equipment performance) and to determine the time in which a given stream can be processed at each quoted node.
The analytical method of stream analysis is ideal for modelling daily order profiles with a known number of staff or target number of items in a stream. It also makes it possible to determine the limit of a stream of goods that can be processed in a given warehouse with the existing or planned technical infrastructure.
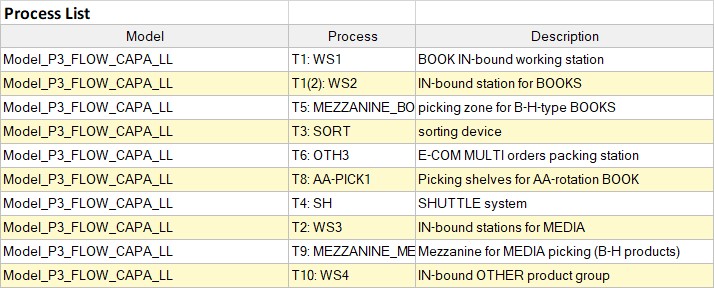
Process mapping
Graphical representation of operations and processes with their interrelationships. Describing the individual elements of the process map uses symbols and graphic icons linking all processes into process chains with their inputs and outputs.
Keep readingEach process mapping must include the following elements:
- process beginning and end
- process structure
- point of entry and exit to and from the process of its components
- definition of the actors taking part in the process (suppliers, employees, etc.)
- who is the process owner (in terms of using its result) or who is responsible for its supervision
- performance evaluation criteria (in practice, a maximum of 4 evaluation indicators are used, because an excessive number of them can cause mutual exclusion and process blockage in consequence)
- impact on the entire process chain – this can include, e.g. indicator of usefulness to develop the final result, the so-called success share indicator
- measurement tools
- criteria and tools for process control
- resources (human, assets, IT, etc.) intended for process execution and affecting its costs
- scenarios of deviation from the primary process
- process documentation
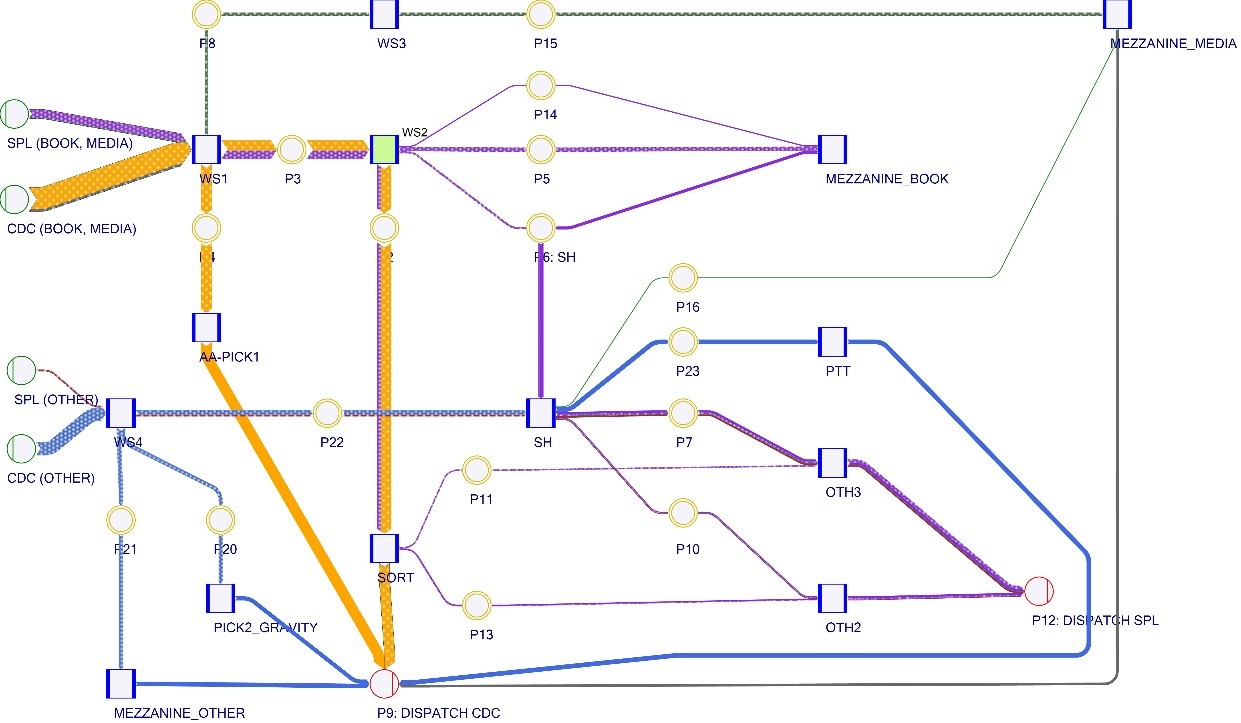
Sankey diagram
A flowchart is a graphical representation of a balance (e.g. of materials, energy). The graph consists of bands of an appropriate width, proportional to the quantity represented. What is important in a Sankey diagram is that the summed width of the input bands is equal to the summed width of the output bands. With stream diagrams, it is easy to identify where process losses occur (stream analysis).
Keep readingThe name of the diagrams is derived from the name of Matthew H. Sankey, an Irish engineer who was first to apply the aforementioned method to demonstrate energy losses during steam machine operation (1898).
Flow charts can be used to represent flows in systems of any scale. In the logistics and warehousing industry, they are used for the flow of warehouse processes, including goods and energy.
Example: